
Introduction
I don’t know why me write & post this is article, maybe because I’m motivated learning about monitoring tools like a Grafana & prometheus. Okay and now I will explain to you about best pratical How To monitor basic metrics from NGINX with Prometheus and Grafana, for your apps , maybe this is basic implementation but not bad for first learning.
First i will explain topology or concept how nginx exporter working to prometheus on this picture

Preparation : I recomended for you read my previous article that explains installation grafana & prometheus in the following link https://igunawan.com/how-to-monitor-mysql-deployments-with-prometheus-grafana-at-mysql-overview/
Actually this configuration is very simple, by activating the sub status module in nginx , and I look refrence for here http://nginx.org/en/docs/http/ngx_http_stub_status_module.html
There are several configuration steps below:
Step Installation 1 – Install & Enable configure stub status Nginx
Example configuration below, this will create a HTTP server on port 9113 only available from localhost and configuration in nginx.conf
server {
        listen localhost:9113;
        location /metrics {
                stub_status on;
        }
}
Make sure to restart the NGINX service
service nginx restart
and This is what the /metrics endpoint will look like
curl http://your_ip:9113/metrics
Active connections: 2
server accepts handled requests
 1468 1468 7418
Reading: 0 Writing: 1 Waiting: 1
Step Installation 2 – Install nginx prometheus exporter & configure
Import exporter nginx from github and running several syntax on below
wget https://github.com/nginxinc/nginx-prometheus-exporter/releases/download/v0.7.0/nginx-prometheus-exporter-0.7.0-linux-amd64.tar.gz
Extract file exporter
tar -xf nginx-prometheus-exporter-0.7.0-linux-amd64.tar.gz
Move file to usr/local/bin and create user for nginx exporter
mv nginx-prometheus-exporter /usr/local/bin/
user add -r nginx_exporter
And then Create Systemd Service File configruation for bridge to data source prometheus
nano /etc/systemd/system/nginx_prometheus_exporter.service
[Unit]
Description=NGINX Prometheus Exporter
After=network.target

[Service]
Type=simple
User=nginx_exporter
Group=nginx_exporter
Type=simple
ExecStart=/usr/local/bin/nginx-prometheus-exporter \
    -web.listen-address=0.0.0.0:9113 \
    -nginx.scrape-uri http://IP_hostnginx:9113/metrics

SyslogIdentifier=nginx_prometheus_exporter
Restart=always

[Install]
WantedBy=multi-user.target
Activate service nginx exporter with following syntax :
systemctl daemon-reload
systemctl restart nginx_prometheus_exporter
systemctl status nginx_prometheus_exporter
Testing with curl http://ip_nginx:9113/metrics
Step Installation 3 – Add endpoint nginx & create display on grafana
- Now just tell prometheus to scrape the exporter, add jobs on
prometheus.yml
scrape_configs:
  - job_name: prometheus
    static_configs:
      - targets: ['localhost:9090']
        labels:
          alias: prometheus

  - job_name: server_nginx
    scrape_interval: 5s
    static_configs:
      - targets: ['0.0.0.0:9113']
        labels:
          alias: nginx_server
Then restart service prometheus and check on the dashboard target promtheus status up for server_nginx
systemctl restart prometheus
systemctl status prometheus

2. Add display dashboard for Nginx overview
This is an example of a grafana dashboard taken from Nginx using “nginx overview” , for a dashboard/template you can import it from the official grafana documentation https://grafana.com/grafana/dashboards/9516-nginx-general-overview/
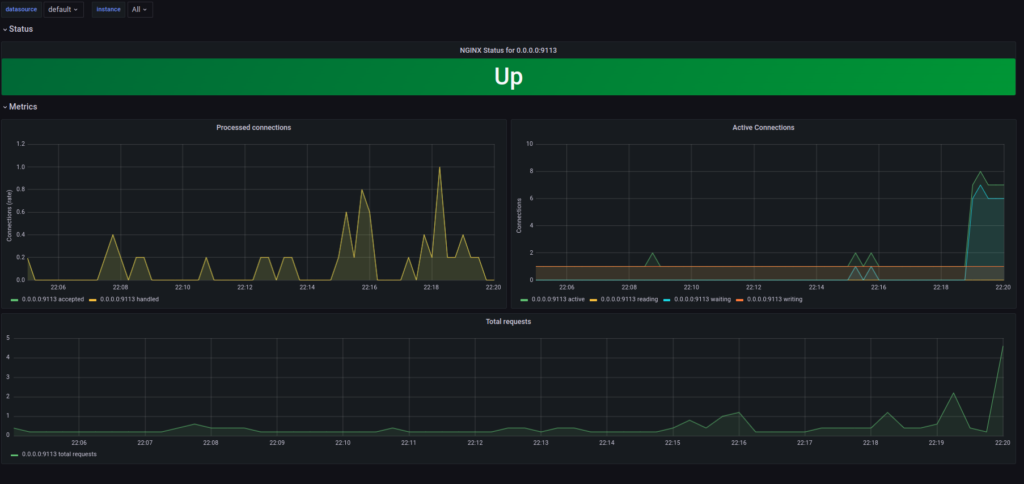
This display is simple, but quite informative, because it provides information on the status of the nginx service up/down, active connection, connection process rate and total request.
Thanks

Admin website igunawan.com, System Administrator, DevOps Engineer


